I honestly should not have gotten the Data and Research internship with Ingenuity. I was completely under qualified. My application was a total shot in the dark; I only hoped the arts education organization in Chicago would see that I applied to every position they offered and maybe understand just how much I wanted to work for them. The internship description called for candidates who had:
- Familiarity with ETL tools for data warehousing (e.g., Zapier, Apatar, CloverETL, Talend, Pentaho)
- Experience writing APIs
- Experience designing and developing software and/or computer systems
Even after nine weeks with Ingenuity, I can’t tell you what half those words mean. Thankfully after reviewing my resume, my supervisor envisioned a different project for me — one that would teach me new skills while still utilizing my writing and research abilities. (I could write a whole other post about what I learned about applying to jobs I think I’m “under qualified” for, but I’ll save that for another time).
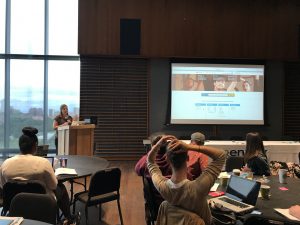
This summer I took the lead on writing the annual State of the Arts report which examines the arts education landscape in Chicago Public Schools (CPS). The 100-page publication will be available in October, and I had a blast collaborating on data analysis with co-workers, providing feedback to the designer, and presenting preliminary findings to Ingenuity and CPS directors. Possibly the best part of the summer was learning how much I enjoy working with data.
As an English and music major, I had firmly established myself as “not a numbers person.” In fact, the only reason I worked to pass AP Calculus in high school was to never have to take a math class again. I wasn’t necessarily bad with numbers, I just didn’t find excitement in them as I did with a good novel or a new piece of music.
However, working on the State of the Arts report showed me that I do actually like numbers — I like numbers that tell a story.
Ingenuity collects A LOT of numbers from schools, arts organizations, private and corporate funders, and the CPS district offices. Some days I spent hours pouring over spreadsheets trying to make sense of all them. My supervisor, co-worker, and I would do mental aerobics trying to figure out how to manipulate numbers into meaningful data. Some days I left the office with a pounding headache and no answers to our numerical problems, but the days we figured out solutions were extremely rewarding.
Once we collected and analyzed our data, it was my job to write it into a narrative. No one wants to read a 100-page report and still be asking “why does this matter?” in the end. By framing our numbers within a larger narrative of supporting schools in providing arts education to every CPS student, our data has meaning.
So while on paper I should never have been made the Data and Research intern at Ingenuity, I ended up being in exactly the right position to learn how important numbers can be in advocating and supporting a field I am passionate about.

Much of the data Ingenuity collects is available at artlookmap.com. This summer, I also had the pleasure of leading a breakout session showing new arts partners how to utilize the website.